
Unsupported versions:2.6 2.5 2.4 2.3 2.2 2.1 2.0
Sample Data
The documentation provides very simple example queries based on a small sample network. To be able to execute the sample queries, run the following SQL commands to create a table with a small network data set.
Create table
CREATE TABLE edge_table (
    id BIGSERIAL,
    dir character varying,
    source BIGINT,
    target BIGINT,
    cost FLOAT,
    reverse_cost FLOAT,
    x1 FLOAT,
    y1 FLOAT,
    x2 FLOAT,
    y2 FLOAT,
    the_geom geometry
);
Insert data
INSERT INTO edge_table (cost,reverse_cost,x1,y1,x2,y2) VALUES ( 1, 1,  2,0,   2,1);
INSERT INTO edge_table (cost,reverse_cost,x1,y1,x2,y2) VALUES (-1, 1,  2,1,   3,1);
INSERT INTO edge_table (cost,reverse_cost,x1,y1,x2,y2) VALUES (-1, 1,  3,1,   4,1);
INSERT INTO edge_table (cost,reverse_cost,x1,y1,x2,y2) VALUES ( 1, 1,  2,1,   2,2);
INSERT INTO edge_table (cost,reverse_cost,x1,y1,x2,y2) VALUES ( 1,-1,  3,1,   3,2);
INSERT INTO edge_table (cost,reverse_cost,x1,y1,x2,y2) VALUES ( 1, 1,  0,2,   1,2);
INSERT INTO edge_table (cost,reverse_cost,x1,y1,x2,y2) VALUES ( 1, 1,  1,2,   2,2);
INSERT INTO edge_table (cost,reverse_cost,x1,y1,x2,y2) VALUES ( 1, 1,  2,2,   3,2);
INSERT INTO edge_table (cost,reverse_cost,x1,y1,x2,y2) VALUES ( 1, 1,  3,2,   4,2);
INSERT INTO edge_table (cost,reverse_cost,x1,y1,x2,y2) VALUES ( 1, 1,  2,2,   2,3);
INSERT INTO edge_table (cost,reverse_cost,x1,y1,x2,y2) VALUES ( 1,-1,  3,2,   3,3);
INSERT INTO edge_table (cost,reverse_cost,x1,y1,x2,y2) VALUES ( 1,-1,  2,3,   3,3);
INSERT INTO edge_table (cost,reverse_cost,x1,y1,x2,y2) VALUES ( 1,-1,  3,3,   4,3);
INSERT INTO edge_table (cost,reverse_cost,x1,y1,x2,y2) VALUES ( 1, 1,  2,3,   2,4);
INSERT INTO edge_table (cost,reverse_cost,x1,y1,x2,y2) VALUES ( 1, 1,  4,2,   4,3);
INSERT INTO edge_table (cost,reverse_cost,x1,y1,x2,y2) VALUES ( 1, 1,  4,1,   4,2);
INSERT INTO edge_table (cost,reverse_cost,x1,y1,x2,y2) VALUES ( 1, 1,  0.5,3.5,  1.999999999999,3.5);
INSERT INTO edge_table (cost,reverse_cost,x1,y1,x2,y2) VALUES ( 1, 1,  3.5,2.3,  3.5,4);

UPDATE edge_table SET the_geom = st_makeline(st_point(x1,y1),st_point(x2,y2)),
dir = CASE WHEN (cost>0 and reverse_cost>0) THEN 'B'   -- both ways
   WHEN (cost>0 and reverse_cost<0) THEN 'FT'  -- direction of the LINESSTRING
   WHEN (cost<0 and reverse_cost>0) THEN 'TF'  -- reverse direction of the LINESTRING
   ELSE '' END;                                -- unknown
Before you test a routing function use this query to fill the source and target columns.
SELECT pgr_createTopology('edge_table',0.001);
Points of interest
When points outside of the graph
CREATE TABLE pointsOfInterest(
    pid BIGSERIAL,
    x FLOAT,
    y FLOAT,
    edge_id BIGINT,
    side CHAR,
    fraction FLOAT,
    the_geom geometry,
    newPoint geometry
);

INSERT INTO pointsOfInterest (x,y,edge_id,side,fraction) VALUES (1.8, 0.4,1,'l',0.4);
INSERT INTO pointsOfInterest (x,y,edge_id,side,fraction) VALUES (4.2, 2.4,15,'r',0.4);
INSERT INTO pointsOfInterest (x,y,edge_id,side,fraction) VALUES (2.6, 3.2,12,'l',0.6);
INSERT INTO pointsOfInterest (x,y,edge_id,side,fraction) VALUES (0.3, 1.8,6,'r',0.3);
INSERT INTO pointsOfInterest (x,y,edge_id,side,fraction) VALUES (2.9, 1.8,5,'l',0.8);
INSERT INTO pointsOfInterest (x,y,edge_id,side,fraction) VALUES (2.2, 1.7,4,'b',0.7);
UPDATE pointsOfInterest SET the_geom = st_makePoint(x,y);

UPDATE pointsOfInterest
    SET newPoint = ST_LineInterpolatePoint(e.the_geom, fraction)
    FROM edge_table AS e WHERE edge_id = id;
Restrictions
CREATE TABLE restrictions (
    rid BIGINT NOT NULL,
    to_cost FLOAT,
    target_id BIGINT,
    from_edge BIGINT,
    via_path TEXT
);

COPY restrictions (rid, to_cost, target_id, from_edge, via_path) FROM stdin WITH NULL '__NULL__' DELIMITER ',';
1,100,7,4,__NULL__
1,100,11,8,__NULL__
1,100,10,7,__NULL__
2,4,8,3,5
3,100,9,16,__NULL__
\.
Images
- Red arrows correspond when cost > 0 in the edge table.
- Blue arrows correspond when reverse_cost > 0 in the edge table.
- Points are outside the graph.
- Click on the graph to enlarge.
Note
On all graphs,
Network for queries marked as directed and cost and reverse_cost columns are used:
When working with city networks, this is recommended for point of view of vehicles.
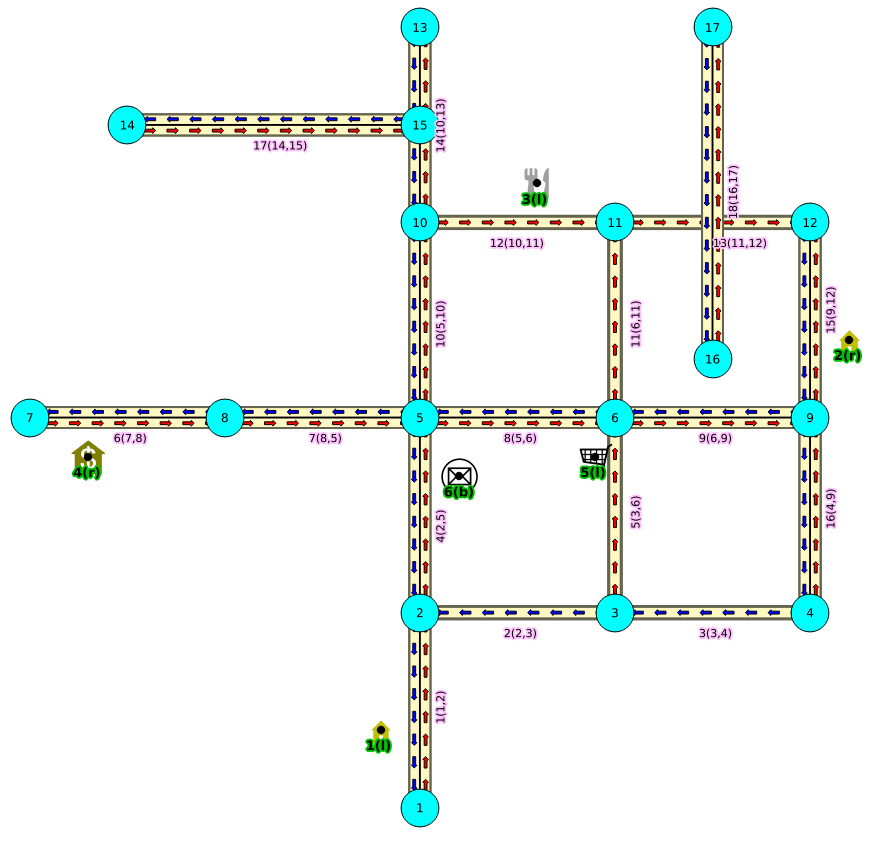
Graph 1: Directed, with cost and reverse cost
Network for queries marked as undirected and cost and reverse_cost columns are used:
When working with city networks, this is recommended for point of view of pedestrians.
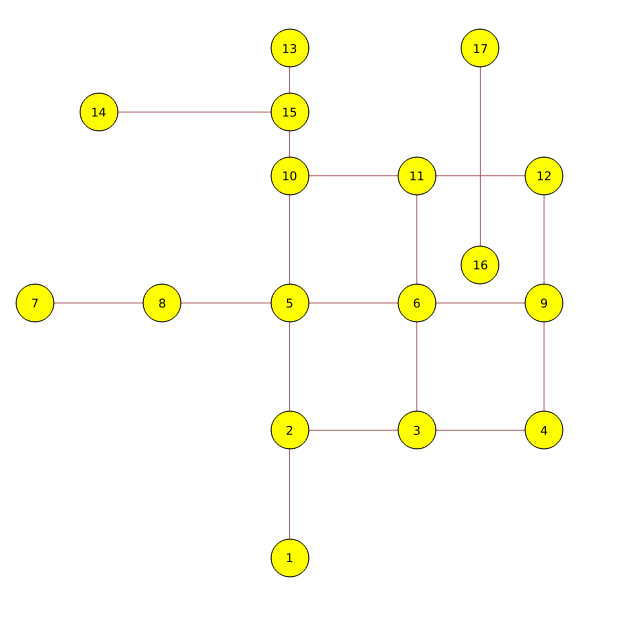
Graph 2: Undirected, with cost and reverse cost
Network for queries marked as directed and only cost column is used:
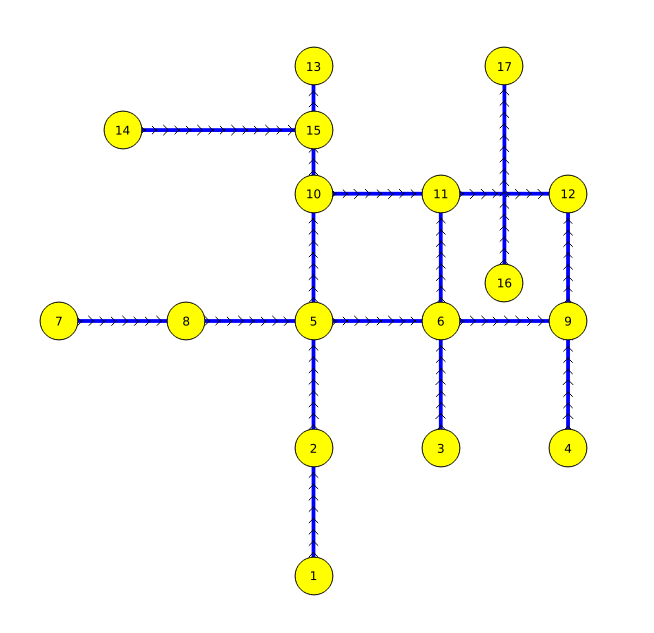
Graph 3: Directed, with cost
Network for queries marked as undirected and only cost column is used:

Graph 4: Undirected, with cost