
Unsupported versions:2.6 2.5 2.4 2.3 2.2 2.1 2.0
Sample Data
The documentation provides very simple example queries based on a small sample network. To be able to execute the sample queries, run the following SQL commands to create a table with a small network data set.
Create table
CREATE TABLE edge_table (
    id serial,
    dir character varying,
    source integer,
    target integer,
    cost double precision,
    reverse_cost double precision,
    x1 double precision,
    y1 double precision,
    x2 double precision,
    y2 double precision,
    the_geom geometry
);
Insert network data
INSERT INTO edge_table (cost,reverse_cost,x1,y1,x2,y2) VALUES ( 1, 1,  2,0,   2,1);
INSERT INTO edge_table (cost,reverse_cost,x1,y1,x2,y2) VALUES (-1, 1,  2,1,   3,1);
INSERT INTO edge_table (cost,reverse_cost,x1,y1,x2,y2) VALUES (-1, 1,  3,1,   4,1);
INSERT INTO edge_table (cost,reverse_cost,x1,y1,x2,y2) VALUES ( 1, 1,  2,1,   2,2);
INSERT INTO edge_table (cost,reverse_cost,x1,y1,x2,y2) VALUES ( 1,-1,  3,1,   3,2);
INSERT INTO edge_table (cost,reverse_cost,x1,y1,x2,y2) VALUES ( 1, 1,  0,2,   1,2);
INSERT INTO edge_table (cost,reverse_cost,x1,y1,x2,y2) VALUES ( 1, 1,  1,2,   2,2);
INSERT INTO edge_table (cost,reverse_cost,x1,y1,x2,y2) VALUES ( 1, 1,  2,2,   3,2);
INSERT INTO edge_table (cost,reverse_cost,x1,y1,x2,y2) VALUES ( 1, 1,  3,2,   4,2);
INSERT INTO edge_table (cost,reverse_cost,x1,y1,x2,y2) VALUES ( 1, 1,  2,2,   2,3);
INSERT INTO edge_table (cost,reverse_cost,x1,y1,x2,y2) VALUES ( 1,-1,  3,2,   3,3);
INSERT INTO edge_table (cost,reverse_cost,x1,y1,x2,y2) VALUES ( 1,-1,  2,3,   3,3);
INSERT INTO edge_table (cost,reverse_cost,x1,y1,x2,y2) VALUES ( 1,-1,  3,3,   4,3);
INSERT INTO edge_table (cost,reverse_cost,x1,y1,x2,y2) VALUES ( 1, 1,  2,3,   2,4);
INSERT INTO edge_table (cost,reverse_cost,x1,y1,x2,y2) VALUES ( 1, 1,  4,2,   4,3);
INSERT INTO edge_table (cost,reverse_cost,x1,y1,x2,y2) VALUES ( 1, 1,  4,1,   4,2);
INSERT INTO edge_table (cost,reverse_cost,x1,y1,x2,y2) VALUES ( 1, 1,  0.5,3.5,  1.999999999999,3.5);
INSERT INTO edge_table (cost,reverse_cost,x1,y1,x2,y2) VALUES ( 1, 1,  3.5,2.3,  3.5,4);


UPDATE edge_table SET the_geom = st_makeline(st_point(x1,y1),st_point(x2,y2)),
                      dir = CASE WHEN (cost>0 and reverse_cost>0) THEN 'B'   -- both ways
                                 WHEN (cost>0 and reverse_cost<0) THEN 'FT'  -- direction of the LINESSTRING
                                 WHEN (cost<0 and reverse_cost>0) THEN 'TF'  -- reverse direction of the LINESTRING
                                 ELSE '' END;                                -- unknown
Before you test a routing function use this query to fill the source and target columns.
SELECT pgr_createTopology('edge_table',0.001);
This table is used in some of our examples
CREATE TABLE vertex_table (
    id serial,
    x double precision,
    y double precision
);
INSERT INTO vertex_table VALUES
        (1,2,0), (2,2,1), (3,3,1), (4,4,1), (5,0,2), (6,1,2), (7,2,2),
        (8,3,2), (9,4,2), (10,2,3), (11,3,3), (12,4,3), (13,2,4);
Network for queries marked as directed and cost and reverse_cost columns are used:
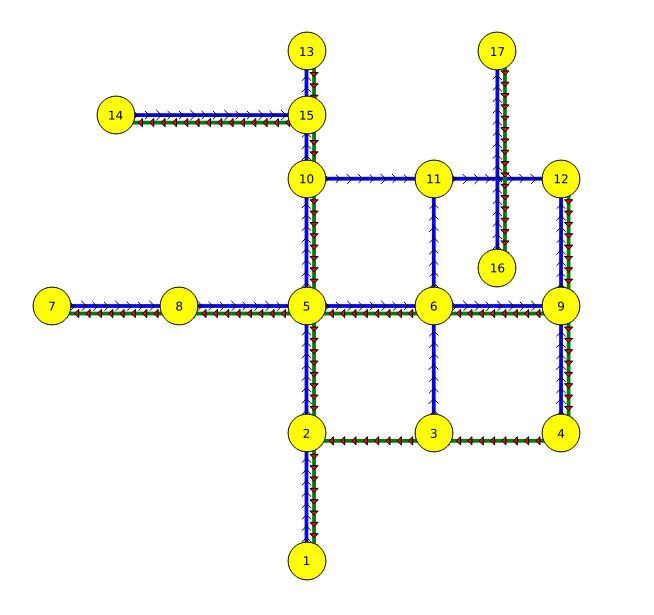
Graph 1: Directed, with cost and reverse cost
Blue colored lines with line arrows, represent the cost of the edge table.
Green colored lines with filled arrows, represent the reverse_cost of the edge table.
Network for queries marked as undirected and cost and reverse_cost columns are used:
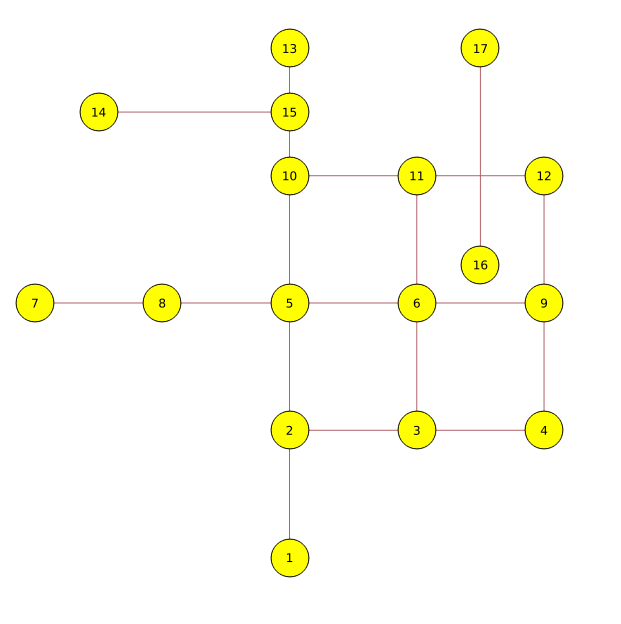
Graph 2: Undirected, with cost and reverse cost
Network for queries marked as directed and only cost column is used:
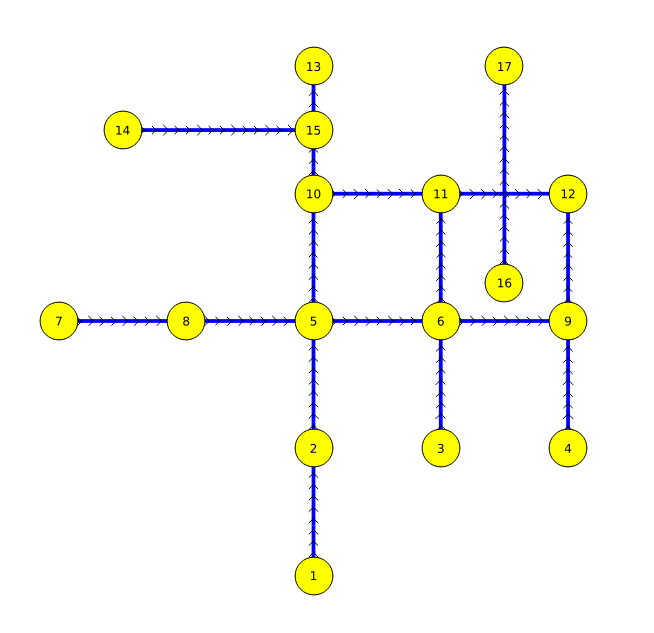
Graph 3: Directed, with cost
Network for queries marked as undirected and only cost column is used:
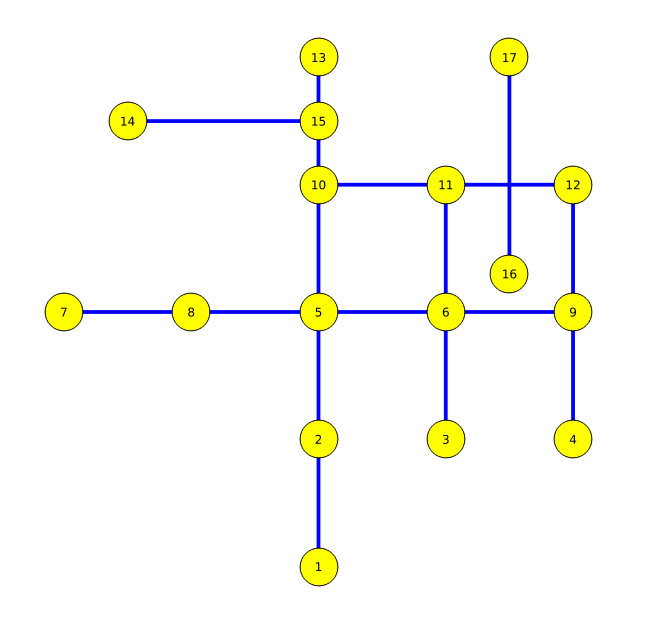
Graph 4: Undirected, with cost